Google Dapper English Edition
转者注
Google 发表:Dapper, a Large-Scale Distributed Systems Tracing Infrastructure
原作地址:https://research.google/pubs/pub36356/
原作发表时间: 2010年4月1日
转者:马晓峰
正文
Dapper, a Large-Scale Distributed Systems Tracing Infrastructure
Benjamin H. Sigelman, Luiz Andre ́ Barroso, Mike Burrows, Pat Stephenson,
Manoj Plakal, Donald Beaver, Saul Jaspan, Chandan Shanbhag
Abstract
Modern Internet services are often implemented as com- plex, large-scale distributed systems. These applications are constructed from collections of software modules that may be developed by different teams, perhaps in different programming languages, and could span many thousands of machines across multiple physical facili- ties. Tools that aid in understanding system behavior and reasoning about performance issues are invaluable in such an environment.
Here we introduce the design of Dapper, Google’s production distributed systems tracing infrastructure, and describe how our design goals of low overhead, application-level transparency, and ubiquitous deploy- ment on a very large scale system were met. Dapper shares conceptual similarities with other tracing systems, particularly Magpie [3] and X-Trace [12], but certain de- sign choices were made that have been key to its success in our environment, such as the use of sampling and re- stricting the instrumentation to a rather small number of common libraries.
The main goal of this paper is to report on our ex- perience building, deploying and using the system for over two years, since Dapper’s foremost measure of suc- cess has been its usefulness to developer and operations teams. Dapper began as a self-contained tracing tool but evolved into a monitoring platform which has enabled the creation of many different tools, some of which were not anticipated by its designers. We describe a few of the analysis tools that have been built using Dapper, share statistics about its usage within Google, present some ex- ample use cases, and discuss lessons learned so far.
1 Introduction
We built Dapper to provide Google’s developers with more information about the behavior of complex dis- tributed systems. Such systems are of special interest because large collections of small servers are a partic- ularly cost-efficient platform for Internet services work- loads [4]. Understanding system behavior in this context requires observing related activities across many differ- ent programs and machines.
A web-search example will illustrate some of the chal- lenges such a system needs to address. A front-end ser- vice may distribute a web query to many hundreds of query servers, each searching within its own piece of the index. The query may also be sent to a number of other sub-systems that may process advertisements, check spelling, or look for specialized results, includ- ing images, videos, news, and so on. Results from all of these services are selectively combined in the results page; we call this model “universal search” [6]. In total, thousands of machines and many different services might be needed to process one universal search query. More- over, web-search users are sensitive to delays, which can be caused by poor performance in any sub-system. An engineer looking only at the overall latency may know there is a problem, but may not be able to guess which service is at fault, nor why it is behaving poorly. First, the engineer may not be aware precisely which services are in use; new services and pieces may be added and modi- fied from week to week, both to add user-visible features and to improve other aspects such as performance or se- curity. Second, the engineer will not be an expert on the internals of every service; each one is built and main- tained by a different team. Third, services and machines may be shared simultaneously by many different clients, so a performance artifact may be due to the behavior of another application. For example, front-ends may handle many different request types, or a storage system such as Bigtable [8] may be most efficient when shared across multiple applications.
The scenario described above gives rise to two funda- mental requirements for Dapper: ubiquitous deployment, and continuous monitoring. Ubiquity is important since the usefulness of a tracing infrastructure can be severly impacted if even small parts of the system are not be- ing monitored. In addition, monitoring should always be turned on, because it is often the case that unusual or otherwise noteworthy system behavior is difficult or im- possible to reproduce. Three concrete design goals result from these requirements:
- Low overhead: the tracing system should have neg- ligible performance impact on running services. In some highly optimized services even small monitor- ing overheads are easily noticeable, and might com- pel the deployment teams to turn the tracing system off.
- Application-level transparency: programmers should not need to be aware of the tracing system. A tracing infrastructure that relies on active collab- oration from application-level developers in order to function becomes extremely fragile, and is often broken due to instrumentation bugs or omissions, therefore violating the ubiquity requirement. This is especially important in a fast-paced development environment such as ours.
- Scalability: it needs to handle the size of Google’s services and clusters for at least the next few years.
An additional design goal is for tracing data to be available for analysis quickly after it is generated: ide- ally within a minute. Although a trace analysis system operating on hours-old data is still quite valuable, the availability of fresh information enables faster reaction to production anomalies.
True application-level transparency, possibly our most challenging design goal, was achieved by restricting Dapper’s core tracing instrumentation to a small corpus of ubiquitous threading, control flow, and RPC library code. Making the system scalable and reducing perfor- mance overhead was facilitated by the use of adaptive sampling, as will be described in Section 4.4. The re- sulting system also includes code to collect traces, tools to visualize them, and libraries and APIs (Application Programming Interfaces) to analyze large collections of traces. Although Dapper alone is sometimes sufficient for a developer to identify the source of a performance anomaly, it is not intended to replace all other tools. We have found that Dapper’s system-wide data often focuses a performance investigation so that other tools can be ap- plied locally.
1.1 Summary of contributions
The design space of distributed systems tracing tools has been explored in a number of excellent previous articles, among which Pinpoint [9], Magpie [3] and X-Trace [12] are most closely related to Dapper. These systems tend to be described in the research literature at a very early point in their development, before there is an opportunity to clearly evaluate important design

Figure 1: The path taken through a simple serving system on behalf of user request X. The letter-labeled nodes represent processes in a distributed system.
choices. Since Dap- per has been in production and operating at large scale for years now, we decided it would be most appropri- ate to focus this paper on what Dapper’s deployment has taught us, how our design decisions played out, and in what ways it has been most useful. The value of Dapper as a platform for development of performance analysis tools, as much as a monitoring tool in itself, is one of a few unexpected outcomes we can identify in a retrospec- tive assessment.
Although Dapper shares many of its high-level ideas with systems such as Pinpoint and Magpie, our imple- mentation contains a number of new contributions in this space. For example, we have found sampling to be nec- essary for low overhead, especially in highly optimized Web services which tend to be quite latency sensitive. Perhaps somewhat more surprisingly, we have found that a sample of just one out of thousands of requests provides sufficient information for many common uses of the trac- ing data.
Another important characteristic of our system is the degree of application-level transparency that we were able to achieve. Our instrumentation is restricted to a low enough level in the software stack that even large- scale distributed systems like Google web search could be traced without additional annotations. Although this is easier to achieve since our deployment environment is blessed with a certain degree of homogeneity, our results in doing so demonstrates some sufficient conditions for realizing such levels of transparency.
2 Distributed Tracing in Dapper
A tracing infrastructure for distributed services needs to record information about all the work done in a sys-tem on behalf of a given initiator. For example, Fig- ure 1 shows a service with 5 servers: a front-end (A), two middle-tiers (B and C) and two backends (D and E). When a user request (the initiator in this case) arrives at the front end, it sends two RPCs to servers B and C. B can respond right away, but C requires work from back- ends D and E before it can reply to A, which in turn re- sponds to the originating request. A simple yet useful distributed trace for this request would be a collection of message identifiers and timestamped events for every message sent and received at each server.
Two classes of solutions have been proposed to ag- gregate this information so that one can associate all record entries with a given initiator (e.g., RequestX in Figure 1), black-box and annotation-based monitoring schemes. Black-box schemes [1, 15, 2] assume there is no additional information other than the message record described above, and use statistical regression techniques to infer that association. Annotation-based schemes [3, 12, 9, 16] rely on applications or middleware to explicitly tag every record with a global identifier that links these message records back to the originating re- quest. While black-box schemes are more portable than annotation-based methods, they need more data in order to gain sufficient accuracy due to their reliance on sta- tistical inference. The key disadvantage of annotation- based methods is, obviously, the need to instrument pro- grams. In our environment, since all applications use the same threading model, control flow and RPC system, we found that it was possible to restrict instrumentation to a small set of common libraries, and achieve a monitor- ing system that is effectively transparent to application developers.
We tend to think of a Dapper trace as a tree of nested RPCs. However, our core data model is not restricted to our particular RPC framework; we also trace activ- ities such as SMTP sessions in Gmail, HTTP requests from the outside world, and outbound queries to SQL servers. Formally, we model Dapper traces using trees, spans, and annotations.
2.1 Trace trees and spans
In a Dapper trace tree, the tree nodes are basic units of work which we refer to as spans. The edges indicate a casual relationship between a span and its parent span. Independent of its place in a larger trace tree, though, a span is also a simple log of timestamped records which encode the span’s start and end time, any RPC timing data, and zero or more application-specific annotations as discussed in Section 2.3.
We illustrate how spans form the structure of a larger trace in Figure 2. Dapper records a human-readable span name for each span, as well as a span id and parent id in order to reconstruct the causal relationships between the individual spans in a single
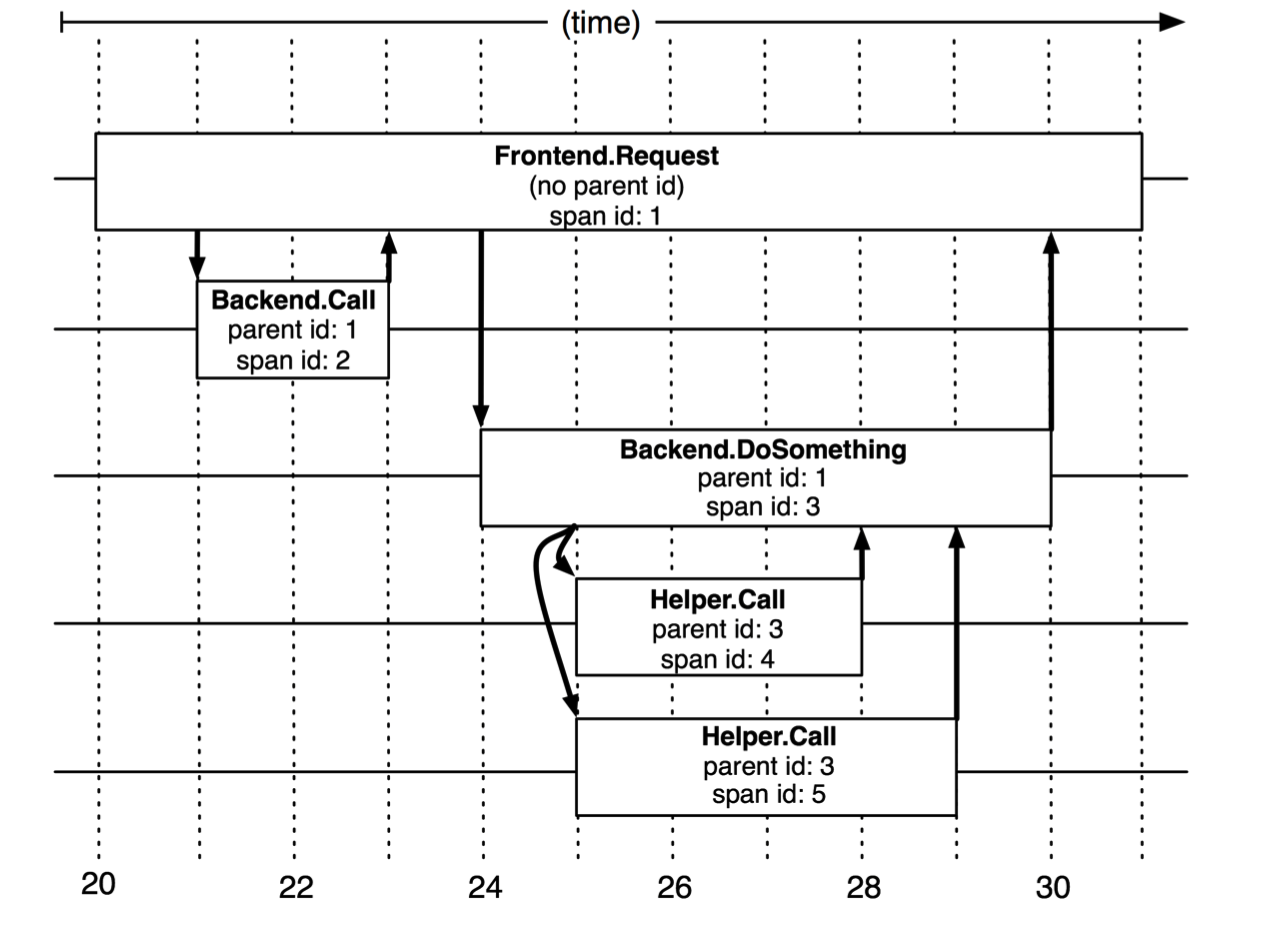
Figure 2: The causal and temporal relationships be- tween five spans in a Dapper trace tree.
distributed trace. Spans created without a parent id are known as root spans. All spans associated with a specific trace also share a com- mon trace id (not shown in the figure). All of these ids are probabilistically unique 64-bit integers. In a typical Dapper trace we expect to find a single span for each RPC, and each additional tier of infrastructure adds an additional level of depth to the trace tree.
Figure 3 provides a more detailed view of the logged events in a typical Dapper trace span. This particular span describes the longer of the two “Helper.Call” RPCs in Figure 2. Span start and end times as well as any RPC timing information are recorded by Dapper’s RPC library instrumentation. If application owners choose to aug- ment the trace with their own annotations (like the “foo” annotation in the figure), these are also recorded with the rest of the span data.
It is important to note that a span can contain informa- tion from multiple hosts; in fact, every RPC span con- tains annotations from both the client and server pro- cesses, making two-host spans the most common ones. Since the timestamps on client and server come from different host machines, we have to be mindful of clock skew. In our analysis tools, we take advantage of the
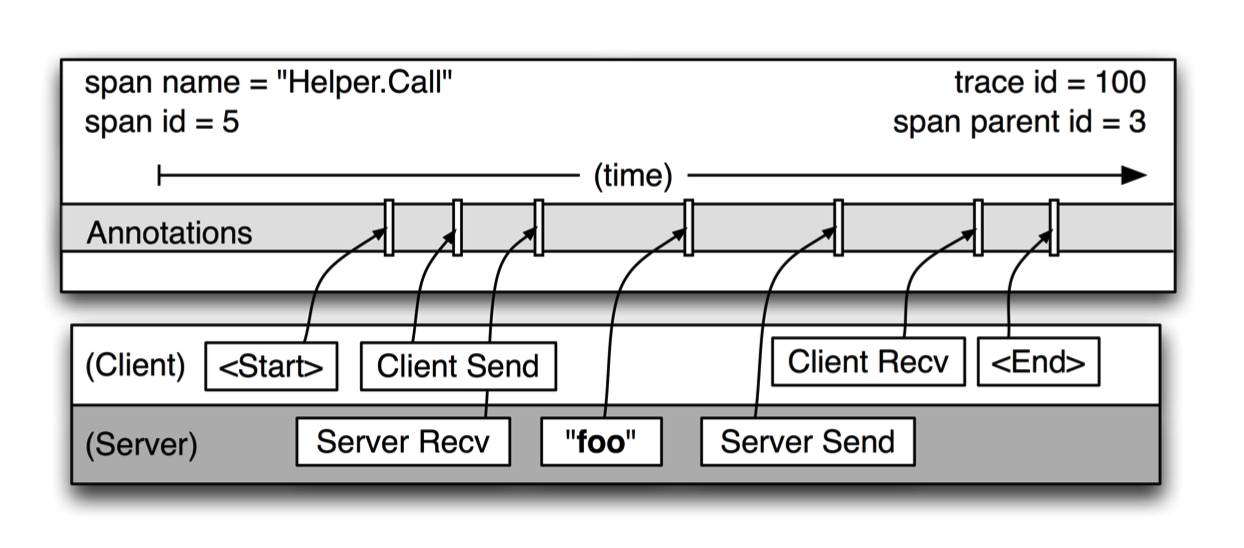
Figure 3: A detailed view of a single span from Fig- ure 2.
fact that an RPC client always sends a request before a server receives it, and vice versa for the server response. In this way, we have a lower and upper bound for the span timestamps on the server side of RPCs.
2.2 Instrumentation points
Dapper is able to follow distributed control paths with near-zero intervention from application developers by re- lying almost entirely on instrumentation of a few com- mon libraries:
- When a thread handles a traced control path, Dap- per attaches a trace context to thread-local storage. A trace context is a small and easily copyable con- tainer of span attributes such as trace and span ids.
- When computation is deferred or made asyn- chronous, most Google developers use a com- mon control flow library to construct callbacks and schedule them in a thread pool or other executor. Dapper ensures that all such callbacks store the trace context of their creator, and this trace con- text is associated with the appropriate thread when the callback is invoked. In this way, the Dapper ids used for trace reconstruction are able to follow asynchronous control paths transparently.
- NearlyallofGoogle’sinter-processcommunication is built around a single RPC framework with bind- ings in both C++ and Java. We have instrumented that framework to define spans around all RPCs. The span and trace ids are transmitted from client to server for traced RPCs. For RPC-based systems like those in wide use at Google, this is an essential instrumentation point. We plan to instrument non- RPC communication frameworks as they evolve and find a user base.
Dapper trace data is language-independent and many traces in production combine data from processes written in both C++ and Java. In Section 3.2 we discuss the level of application transparency we were able to achieve in practice.
2.3 Annotations
The instrumentation points described above are sufficient to derive detailed traces of complex distributed systems, making the core Dapper functionality available to oth- erwise unmodified Google applications. However, Dap- per also allows application developers to enrich Dapper traces with additional information that may be useful to monitor higher level system behavior or to
// C++:
const string& request = ...; if (HitCache())
TRACEPRINTF("cache hit for %s", request.c_str()); else
TRACEPRINTF("cache miss for %s", request.c_str());
// Java:
Tracer t = Tracer.getCurrentTracer(); String request = ...;
if (hitCache())
t.record("cache hit for " + request); else
t.record("cache miss for " + request);
Figure 4: Common-case usage patterns for Dapper’s annotation APIs in C++ and Java.
help in debug- ging problems. We allow users to define timestamped annotations through a simple API, the heart of which is shown in Figure 4. These annotations can have arbitrary content. In order to protect Dapper users from accidental overzealous logging, individual trace spans have a con- figurable upper-bound on their total annotation volume. Application-level annotations are not able to displace the structural span or RPC information regardless of appli- cation behavior.
In addition to simple textual annotations, Dapper also supports a map of key-value annotations that give devel- opers more tracing power, such as maintaining counters, logging binary messages, and transporting arbitrary user- defined data along with a traced request within a pro- cess. These key-value annotations are used to define application-specific equivalence classes within the con- text of distributed traces.
2.4 Sampling
Low overhead was a key design goal for Dapper, since service operators would be understandably reluctant to deploy a new tool of yet unproven value if it had any sig- nificant impact on performance. Moreover, we wanted to allow developers to use the annotation API without fear of the additional overhead. We have also found that some classes of Web services are indeed sensitive to in- strumentation overheads. Therefore, besides making the basic instrumentation overhead of Dapper collection as small as possible, we further control overhead by record- ing only a fraction of all traces. We discuss this trace sampling scheme in more detail in Section 4.4.
2.5 Trace collection
The Dapper trace logging and collection pipeline is a three-stage process (see Figure 5). First, span data is written (1) to local log files. It is then pulled (2) from all production hosts by Dapper daemons and collection in- frastructure and finally written (3) to a
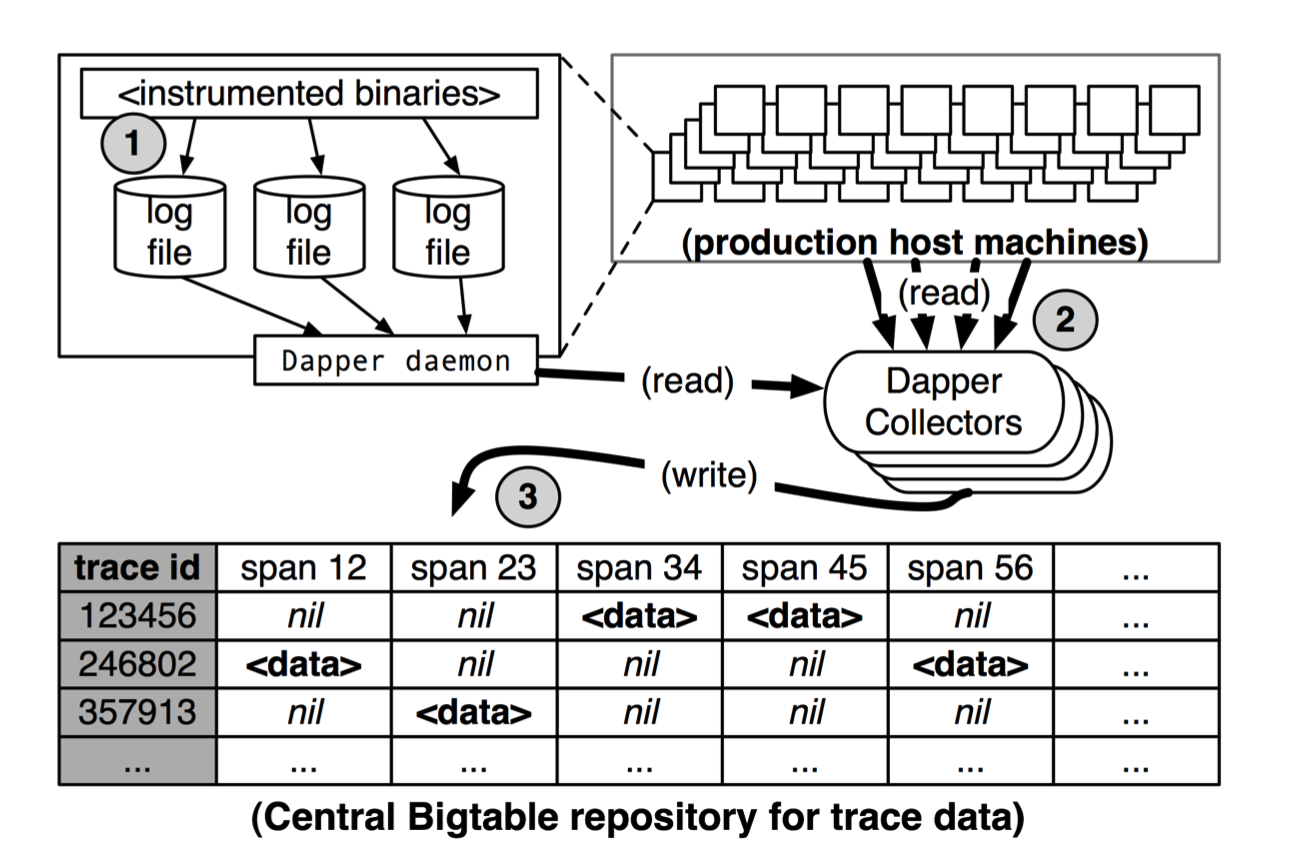
Figure 5: An overview of the Dapper collection pipeline.
cell in one of sev- eral regional Dapper Bigtable [8] repositories. A trace is laid out as a single Bigtable row, with each column corresponding to a span. Bigtable’s support for sparse table layouts is useful here since individual traces can have an arbitrary number of spans. The median latency for trace data collection – that is, the time it takes data to propagate from instrumented application binaries to the central repository – is less than 15 seconds. The 98th per- centile latency is itself bimodal over time; approximately 75% of the time, 98th percentile collection latency is less than two minutes, but the other approximately 25% of the time it can grow to be many hours.
Dapper also provides an API to simplify access to the trace data in our repository. Developers at Google use this API to build both general-purpose and application- specific analysis tools. Section 5.1 contains more infor- mation about its usage thus far.
2.5.1 Out-of-band trace collection
The Dapper system as described performs trace logging and collection out-of-band with the request tree itself. This is done for two unrelated reasons. First, an in-band collection scheme – where trace data is sent back within RPC response headers – can affect application network dynamics. In many of the larger systems at Google, it is not uncommon to find traces with thousands of spans. However, RPC responses – even near the root of such large distributed traces – can still be comparatively small: often less than ten kilobytes. In cases like these, the in- band Dapper trace data would dwarf the application data and bias the results of subsequent analyses. Secondly, in-band collection schemes assume that all RPCs are per- fectly nested. We find that there are many middleware systems which return a result to their caller before all of their own backends have returned a final result. An in-band collection system is unable to account for such non-nested distributed execution patterns.
2.6 Security and privacy considerations
Logging some amount of RPC payload information would enrich Dapper traces since analysis tools might be able to find patterns in payload data which could ex- plain performance anomalies. However, there are several situations where the payload data may contain informa- tion that should not be disclosed to unauthorized internal users, including engineers working on performance de- bugging.
Since security and privacy concerns are non- negotiable, Dapper stores the name of RPC methods but does not log any payload data at this time. Instead, application-level annotations provide a convenient opt-in mechanism: the application developer can choose to as- sociate any data it determines to be useful for later anal- ysis with a span.
Dapper has also provided some security benefits that were not anticipated by its designers. By tracing pub- lic security protocol parameters, Dapper is used to mon- itor whether applications are satisfying security policies through proper levels of authentication or encryption, for example. Dapper can also provide information to en- sure that policy-based isolation of systems is enforced as expected, e.g. that applications which bear sensitive data are not interacting with unauthorized system com- ponents. These kinds of measurements provide greater assurance than source code audits.
3 Dapper Deployment Status
Dapper has been our production tracing system for over two years. In this section we report on the status of the system, focusing on how well it met our objectives of ubiquitous deployment and application-level trans- parency.
3.1 Dapper runtime library
Perhaps the most critical part of Dapper’s code base is the instrumentation of basic RPC, threading and control flow libraries, which includes span creation, sampling, and logging to local disks. Besides being lightweight, this code needs to be stable and robust since it is linked into a vast number of applications, making maintenance and bug fixing difficult. The core instrumentation is less than 1000 lines of code in C++ and under 800 lines in Java. The implementation of key-value annotations adds an additional 500 lines of code.
3.2 Production coverage
Dapper penetration can be assessed in two dimensions: the fraction of production processes that can generate Dapper traces (i.e., those that are linked with Dapper- instrumented runtime libraries) and the fraction of pro- duction machines running Dapper’s trace collection dae- mon. Dapper’s daemon is part of our basic machine image, making it present on virtually every server at Google. It is difficult to determine the precise fraction of Dapper-ready processes since processes generating no trace information are invisible to Dapper. However, given how ubiquitous Dapper-instrumented libraries are, we estimate that nearly every Google production process supports tracing.
There are cases where Dapper is unable to follow the control path correctly. These typically stem from the use of non-standard control-flow primitives, or when Dap- per mistakenly attributes causality to unrelated events. Dapper provides a simple library to help developers control trace propagation manually as a work-around. Presently there are 40 C++ applications and 33 Java ap- plications that required some manual trace propagation, corresponding to a small fraction of the totals which number in the thousands. There is also a very small num- ber of programs that use uninstrumented communication libraries (raw TCP sockets, or SOAP RPCs, for exam- ple), and therefore do not support Dapper tracing. Dap- per support can be added to these applications, if it is deemed important.
Dapper tracing can be turned off as a production safety measure. In fact it was off by default during its early days, until we built confidence in its stability and low overhead. The Dapper team performs occasional audits looking for changes to configurations where tracing is turned off by a service owner. Such changes are rare and usually stem from concerns about monitoring overhead. All of these changes to date have been reverted upon fur- ther investigation and measurement of the actual over- head, which has been immaterial.
3.3 Use of trace annotations
Programmers tend to use application-specific annota- tions either as a kind of distributed debug log file or to classify traces by some application-specific feature. For example, all Bigtable requests are annotated with the name of the table being accessed. Currently, 70% of all Dapper spans and 90% of all Dapper traces have at least one application-specified annotation.
41 Java and 68 C++ applications have added cus- tom application annotations in order to better understand intra-span activity in their services. It is worth noting that our Java developers who have adopted the anno-tation API have made more annotations per span than their C++ counterparts thus far. This may be because our Java workloads tend to be closer to the end user; these sorts of applications often handle a wider mix of requests and consequently have comparatively complex control paths.
4 Managing Tracing Overhead
The cost of a tracing system is felt as performance degra- dation in the system being monitored due to both trace generation and collection overheads, and as the amount of resources needed to store and analyze trace data. Al- though one can argue that a valuable tracing infrastruc- ture could be worth a performance penalty, we believed that initial adoption would be greatly facilitated if the baseline overheads could be demonstrably negligible.
In this section we present the overhead of the main Dapper instrumentation operations, the overhead of the trace collection, and the impact of Dapper on a produc- tion workload. We also describe how Dapper’s adaptive trace sampling mechanism helps us balance the need for low overhead and the desire for representative traces.
4.1 Trace generation overhead
Trace generation overhead is the most critical segment of Dapper’s performance footprint, since collection and analysis can more easily be turned off in an emergency. The most important sources of trace generation overhead in the Dapper runtime libraries are creating and destroy- ing spans and annotations, and logging them to local disk for subsequent collection. Root span creation and de- struction takes 204 nanoseconds on average, while the same operation for non-root spans takes 176 nanosec- onds. The difference is the added cost of allocating a globally unique trace id for root spans.
The cost of additional span annotations is almost neg- ligible if the span is not sampled for tracing, consisting of a thread-local lookup in the Dapper runtime, averag- ing about 9 nanoseconds. If it is sampled, annotating the trace with a string literal – much like what’s shown in Figure 4 – costs 40 nanoseconds on average. These mea- surements were made on a 2.2GHz x86 server.
Writes to local disk are the most expensive operation in Dapper’s runtime library, but their visible overhead is much reduced since each disk write coalesces multi- ple log file write operations and executes asynchronously with respect to the traced application. Nevertheless, log write activity can have a perceptible impact on high- throughput application performance, especially if all re- quests are being traced. We quantify this overhead in a Web search workload in Section 4.3.
| Process Count (per host) | Data Rate (per process) | Daemon CPU Usage (single CPU core) |
|---|---|---|
| 25 10 50 |
10K/sec 200K/sec 2K/sec |
0.125% 0.267% 0.130% |
Table 1: CPU resource usage for the Dapper daemon during load testing
| Sampling frequency | Avg. Latency (% change) | Avg. Throughput (% change) |
|---|---|---|
| 1/1 1/2 1/4 1/8 1/16 1/1024 |
16.3% 9.40% 6.38% 4.12% 2.12% −0.20% |
−1.48% −0.73% −0.30% −0.23% −0.08% −0.06% |
Table 2: The effect of different [non-adaptive] Dap- per sampling frequencies on the latency and through- put of a Web search cluster. The experimental errors for these latency and throughput measurements are 2.5% and 0.15% respectively.
4.2 Trace collection overhead
Reading out local trace data can also interfere with the foreground workload being monitored. Table 1 shows worst case CPU usage of the Dapper daemon process based on an unrealistically heavy load testing bench- mark. The daemon never uses more than 0.3% of one core of a production machine during collection, and has a very small memory footprint (within the noise of heap fragmentation). We also restrict the Dapper daemon to the lowest possible priority in the kernel scheduler in case CPU contention arises within a heavily-loaded host machine.
Dapper is also a light consumer of network resources, with each span in our repository corresponding to only 426 bytes on average. Taken as a fraction of the network activity in the applications we’re monitoring, Dapper trace data collection is responsible for less than 0.01% of the network traffic in Google’s production environment.
4.3 Effect on production workloads
High-throughput on-line services that utilize large num- bers of machines for each request are some of the most demanding to trace efficiently; they tend to generate the largest volume of tracing data, while they are also the most sensitive to performance interference. In Table 2 we use our web search cluster as an example of such a service; we measure the performance impact of Dapper on average latency and throughput as we vary the ratio of sampled traces.
We see that although the impact on throughput is not very significant, in order to avoid noticeable la- tency degradation, trace sampling is indeed necessary. However, the latency and throughput penalties associ- ated with sampling frequencies less than 1/16 are all within the experimental error. In practice, we have found that there is still an adequate amount of trace data for high-volume services when using a sampling rate as low as 1/1024. Keeping the baseline Dapper overhead ex- tremely low is important since it gives some slack for ap- plications to use the full breadth of the annotation API without fear of performance penalties. Using a lower sampling frequency has the added benefit of allowing data to persist longer on the local disks of host machines before being garbage-collected, which gives more flexi- bility to the collection infrastructure.
4.4 Adaptive sampling
The Dapper overhead attributed to any given process is proportional to the number of traces that process sam- ples per unit time. The first production version of Dap- per used a uniform sampling probability for all processes at Google, averaging one sampled trace for every 1024 candidates. This simple scheme was effective for our high-throughput online services since the vast majority of events of interest were still very likely to appear often enough to be captured.
However, lower traffic workloads may miss important events at such low sampling rates, while tolerating higher sampling rates with acceptable performance overheads. The solution for such systems is to override the default sampling rate, which requires the kind of manual inter- vention that we sought to avoid in Dapper.
We are in the process of deploying an adaptive sam- pling scheme that is parameterized not by a uniform sam- pling probability, but by a desired rate of sampled traces per unit time. This way, workloads with low traffic au- tomatically increase their sampling rate while those with very high traffic will lower it so that overheads remain under control. The actual sampling probability used is recorded along with the trace itself; this facilitates ac- curate accounting of trace frequencies in analytical tools built around Dapper data.
4.5 Coping with aggressive sampling
New Dapper users often wonder if low sampling proba- bilities – often as low as 0.01% for high-traffic services – will interfere with their analyses. Our experience at Google leads us to believe that, for high-throughput ser- vices, aggressive sampling does not hinder most impor- tant analyses. If a notable execution pattern surfaces once in such systems, it will surface thousands of times. Services with lower volume – perhaps dozens rather than tens of thousands of requests per second – can afford to trace every request; this is what motivated our decision to move towards adaptive sampling rates.
4.6 Additional sampling during collection
The sampling mechanisms described above were de- signed to minimize perceptible overhead in applications which incorporate the Dapper runtime library. The Dap- per team also needs to control the total size of data writ- ten to its central repositories, though, and thus we incor- porate a second round of sampling for that purpose.
Our production clusters presently generate more than 1 terabyte of sampled trace data per day. Dapper users would like trace data to remain available for at least two weeks after it was initially logged from a production pro- cess. The benefits of increased trace data density must then be weighed against the cost of machines and disk storage for the Dapper repositories. Sampling a high fraction of requests also brings the Dapper collectors un- comfortably close to the write throughput limit for the Dapper Bigtable repository.
In order to maintain flexibility around both the mate- rial resource requirements and the cumulative Bigtable write throughput, we added support for additional sam- pling in the collection system itself. We leverage the fact that all spans for a given trace – though they may be spread across thousands of distinct host machines – share a common trace id. For each span seen in the col- lection system, we hash the associated trace id as a scalar z, where 0 ≤ z ≤ 1. If z is less than our collection sam- pling coefficient, we keep the span and write it to the Bigtable. Otherwise, we discard it. By depending on the trace id for our sampling decision, we either sam- ple or discard entire traces rather than individual spans within traces. We have found that this additional config- uration parameter makes the administration of our col- lection pipeline much simpler, as we can easily adjust our global write rate by changing a single parameter in a configuration file.
It would be simpler if there was only one sampling pa- rameter for the entire tracing and collection system, but it is not feasible to quickly adjust the runtime sampling configuration in all deployed binaries. We have chosen a runtime sampling rate which yields slightly more data than we can write to our repositories, and we throttle that write rate with the secondary sampling coefficient in the collection system. Dapper pipeline maintenance is easier since we can augment or diminish our global coverage and write-rate immediately with a single change to our secondary sampling configuration.
5 General-Purpose Dapper Tools
Several years ago while Dapper was still a prototype, it was only usable with the patient assistance of the Dapper developers. Since then, we have iteratively built up the collection infrastructure, programming interfaces, and an interactive web-based user interface to help Dapper users solve their problems independently. In this section, we summarize which approaches have worked and which haven’t, and we provide basic usage information about these general-purpose analytical tools.
5.1 The Dapper Depot API
The Dapper “Depot API,” or DAPI, provides direct ac- cess to the distributed trace records in the regional Dap- per repositories (or “Depots”). The DAPI and the Dap- per trace repositories were designed in tandem, and the DAPI is meant to expose a clean and intuitive interface to the raw data contained within these Dapper reposito- ries. Our use cases suggested the following three ways to access trace data:
Access by trace id: The DAPI can load any trace on demand given its globally unique trace id.
Bulk access: The DAPI can leverage MapReduce to pro- vide access to billions of Dapper traces in parallel. The user overrides a virtual function which accepts a Dapper trace as its only argument, and the framework will in- voke that function once for every collected trace within a user-specified time window.
Indexed access: The Dapper repositories support a sin- gle index which has been chosen to match our com- mon access patterns. This index maps from commonly- requested trace features (described below) to distinct dapper traces. Since trace ids are allocated pseudo- randomly, this is the best way to quickly access traces associated with a specific service or host machine.
All three access patterns lead the user to distinct Dap- per trace records. As described earlier in Section 2.1, Dapper traces are modelled as trees of trace spans, so the Trace data structure is consequently a simple traversable tree of individual Span structures. The spans often correspond to RPC calls, and, in those cases, RPC timing information is available. Timestamped applica- tion annotations are also accessible via the span struc- tures.
The choice of an appropriate custom index was the most challenging aspect of the DAPI design. The com- pressed storage required for an index into the trace data is only 26% less than for the actual trace data itself, so the costs are significant. Initially, we deployed two in- dices: one index for host machines, and one for service names. However, we did not find sufficient interest in the machine-based indices to justify their storage cost. When users were interested in individual machines, they were also interested in a specific service, so we eventu- ally combined the two into a composite index which al- lows for efficient lookup by service name, host machine, and timestamp, in that order.
5.1.1 DAPI usage within Google
There are three classes of DAPI usage at Google: persis- tent online web applications which make use of DAPI, well-maintained DAPI-based tools which can be run on- demand from the command line, and one-off analyti- cal tools which are written, run, and mostly forgotten. Respectively, we know of 3 persistent DAPI-based ap- plications, 8 additional on-demand DAPI-based analy- sis tools, and about 15-20 one-off analytical tools built using the DAPI framework. It’s difficult to account for tools in this latter category since developers can build, run, and abandon these projects without the knowledge of the Dapper team.
5.2 The Dapper user interface
Most Dapper usage takes place within the interactive web-based user interface. Space considerations do not allow us to demonstrate every feature therein, but a typi- cal user workflow is shown in Figure 6.
1: The user describes the service and time window they’re interested in, as well as whatever information they need to distinguish trace patterns (in this case, the span name). They also specify a cost metric most rele- vant to their investigation (in this case, service latency).
2: A large table of performance summaries for all dis- tributed execution patterns associated with the given ser- vice appears. The user may sort these execution patterns as they wish and choose one to view in more detail.
3: Once a single distributed execution pattern is se- lected, the user is presented with a graphical depiction of said execution pattern. The service under examination is highlighted in the center of the diagram.
4: After creating buckets which correspond to subdivi- sions of the cost metric space selected in step #1, the Dapper user interface presents a simple frequency his- togram over that metric space. So, in this example, we can see that there’s a roughly log normal distribution of latencies for the selected execution pattern. The user is also presented with a list of specific example traces which fall into different ranges of the histogram. In this case, the user clicks on the second example trace, which brings them to the trace inspection view in the Dapper user interface.
5: Many if not most Dapper users eventually aim to in- spect specific traces in hopes of gleaning information about root causes of system behavior. We do not have enough space to do the trace view justice, but it is charac- terized by a global time line (seen at the top) and the abil- ity to expand and collapse subtrees interactively. Suc- cessive tiers of the distributed trace tree are represented by nested colored rectangles. Every RPC span is bro- ken down further into time spent within a server process (green) and time spent on the network (blue). User an- notations are not shown in this screenshot, but they may be selectively included in the global time line on a span- by-span basis.
For users seeking real-time data, the Dapper user inter- face is capable of communicating directly with Dapper daemons on each production machine. In that mode, it is not possible to look at system-level diagrams as shown above, but it is still easy to select individual traces based on latency or network characteristics. In that mode of op- eration, the data is available within seconds of real time.
According to our logs, roughly 200 different Google engineers use the Dapper UI on a typical weekday; over the course of the week, accordingly, there are approxi- mately 750-1000 distinct users. Those numbers are con- sistent from month to month modulo internal announce- ments of new features. It is common for users to send out links to specific traces of interest which will in- evitably generate much one-time, short-duration traffic in the trace inspector.
6 Experiences
Dapper is used widely at Google, both directly through the Dapper user interface and indirectly through the pro- grammatic APIs or applications built on top of those APIs. In this section we do not attempt to catalog every known use of Dapper, but instead attempt to cover the “basis vectors” of Dapper usage in an effort to illustrate what sorts of applications have been most successful.
6.1 Using Dapper during development
The Google AdWords system is built around a large database of keyword targeting criteria and associated textual advertisements. When new keywords or adver- tisements are either inserted or modified, they must be checked for adherence to service policy terms (such as inappropriate language); a process that is made more ef- ficient by an automated review system.
When it came time to re-engineer one of Ads Review’s services from the ground up, the team used Dapper iter-atively from the
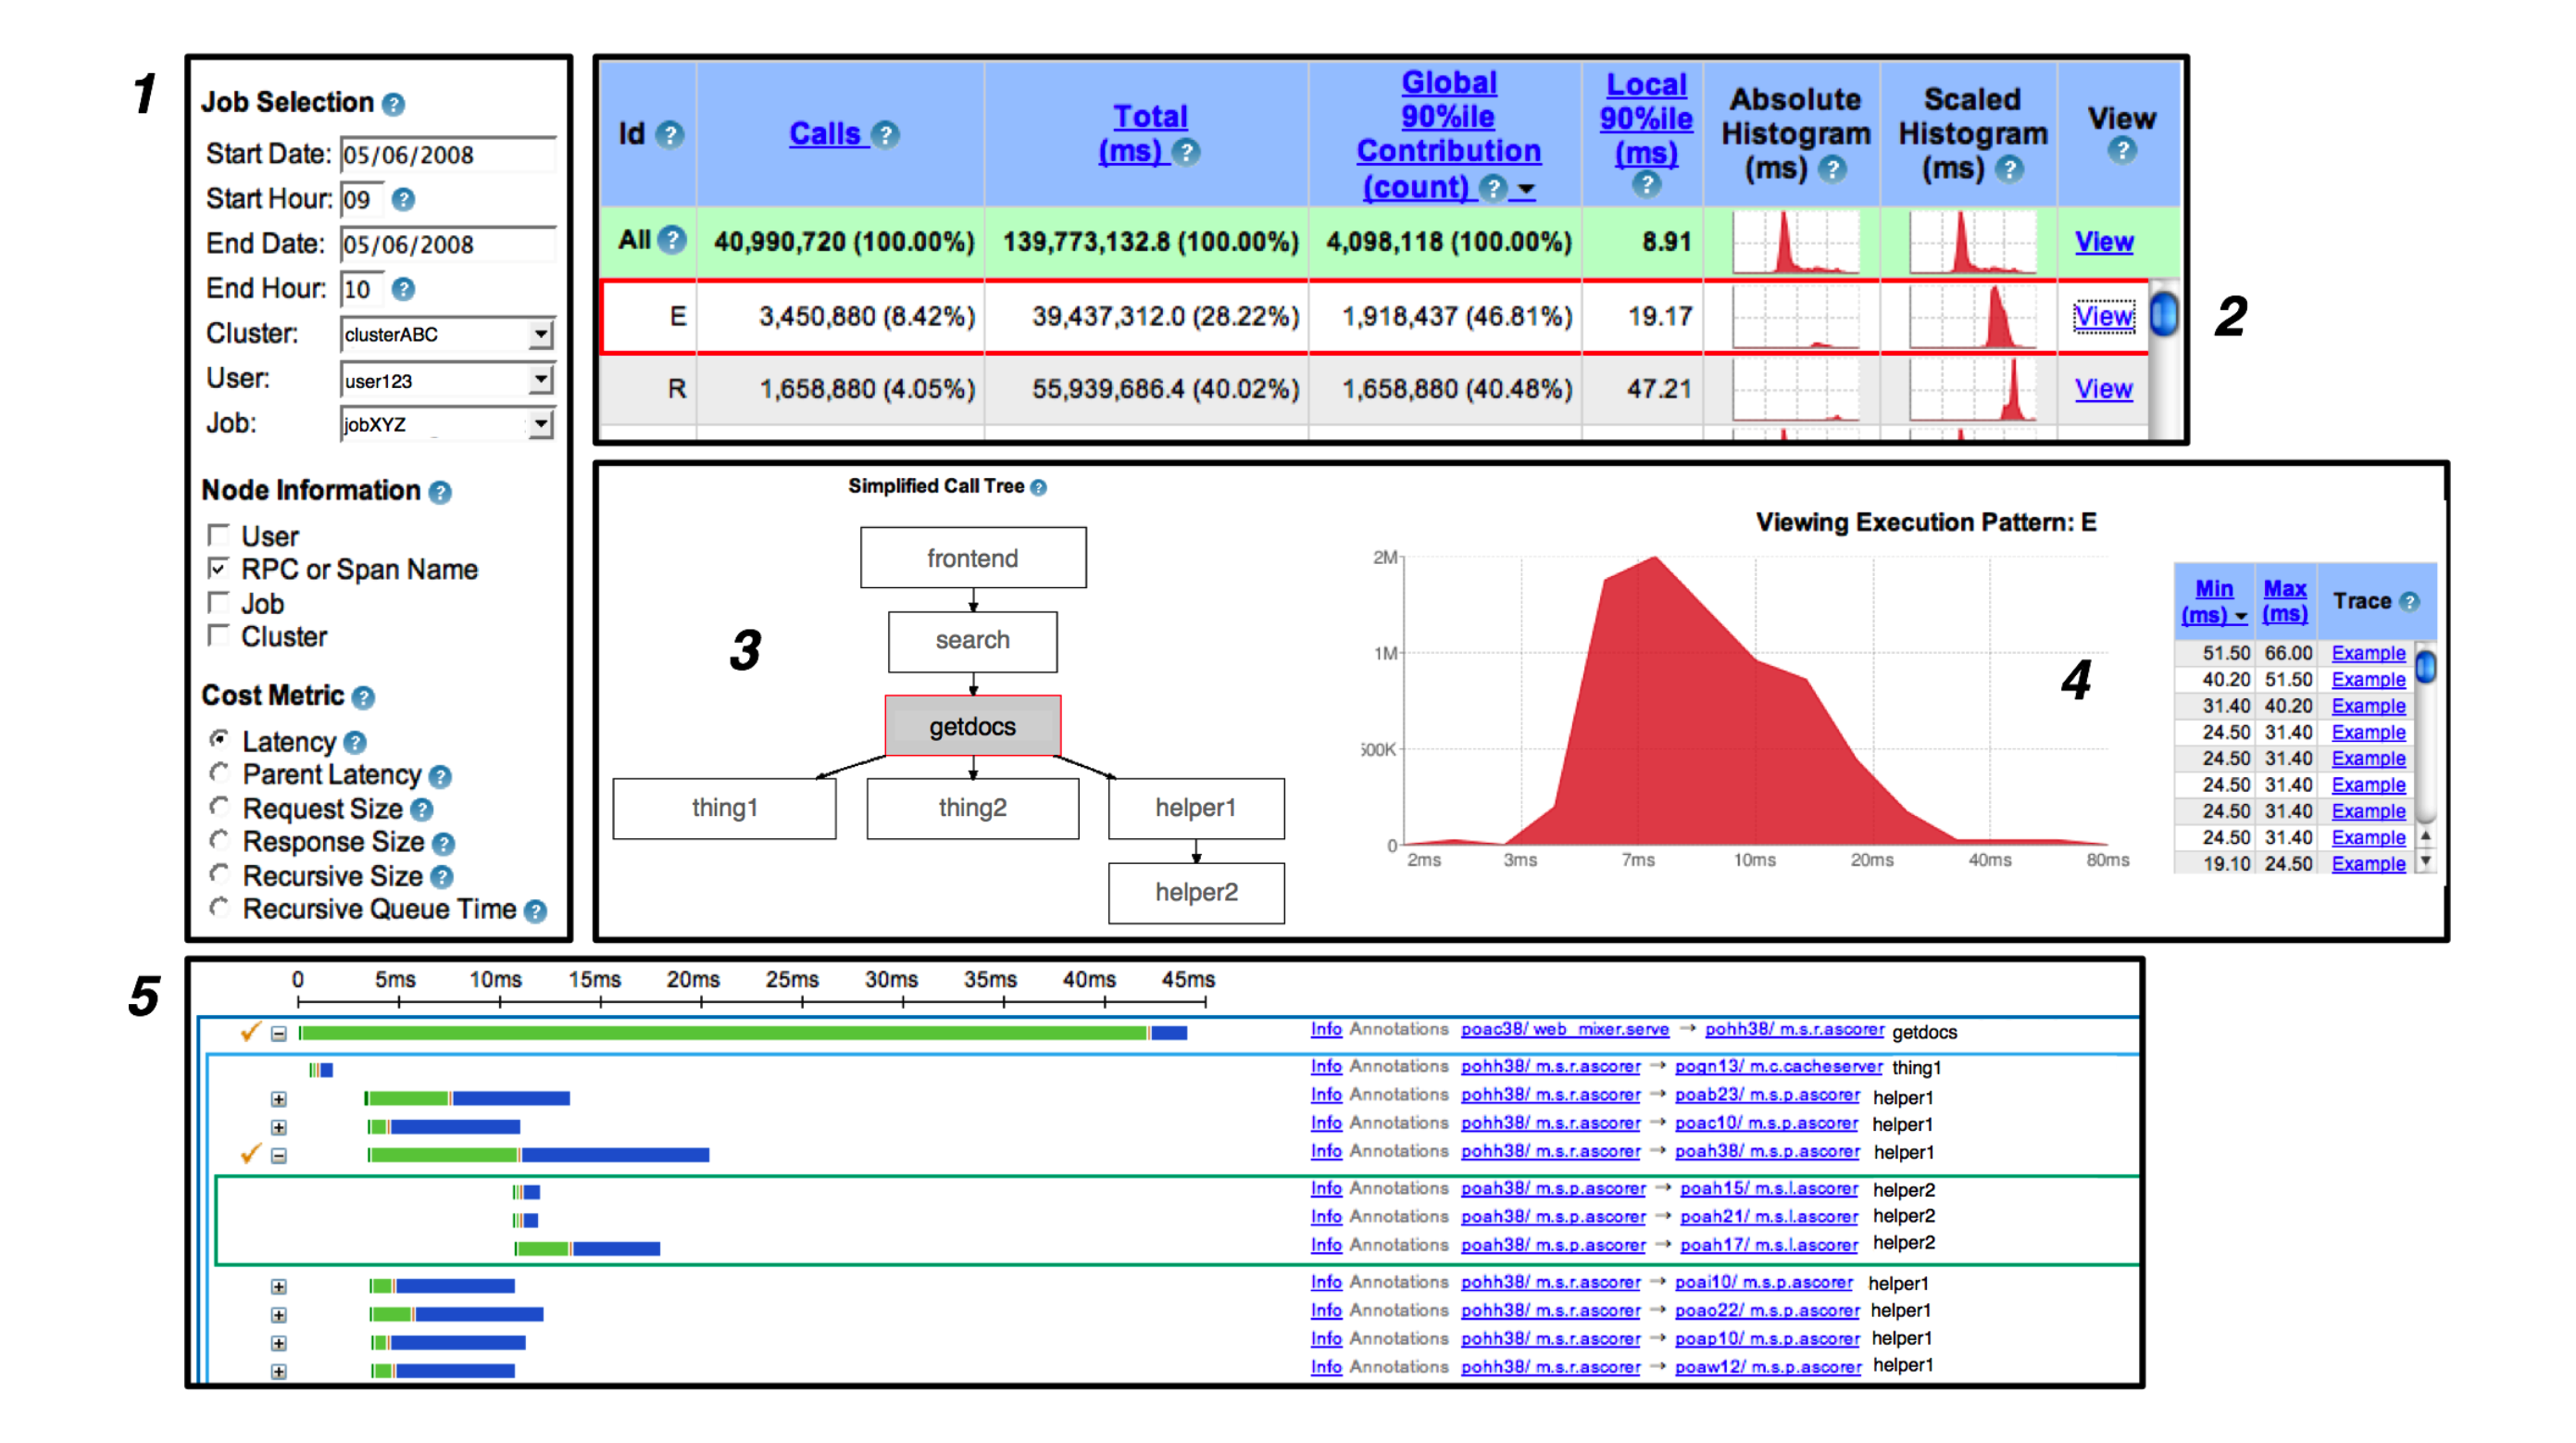
Figure 6: A typical user workflow in the general-purpose Dapper user interface.
first system prototypes through launch and, eventually, maintenance of their system. Dapper helped them improve their service in the following ways:
Performance: Developers tracked progress against re- quest latency targets and pinpointed easy optimization opportunities. Dapper was also used to identify unneces- sary serial requests along the critical path – often origi- nating in sub-systems the developers didn’t write them- selves – and prompting the team to subsequently fix them.
Correctness: The Ads Review service revolves around a large database system. That system has both read-only replicas (inexpensive access) and read-write masters (ex- pensive access). Dapper was used to identify a number of cases where queries were needlessly issued to the master instead of the replicas. It is now possible to account for cases where the masters are accessed directly and guar- antee important system invariants.
Understanding: Ads Review queries fan out across many types of systems, including BigTable, the afore- mentioned database, a multi-dimensional indexing ser- vice, and various other C++ and Java backend services. Dapper traces were used to assess the total query cost, and prompted an effort to redesign operations in order to minimize load on their system dependencies.
Testing: New code release goes through a Dapper trace QA process, which verifies correct system behavior and performance. A number of issues were discovered using this process, both in the Ads Review code itself and in supporting libraries.
The Ads Review team made extensive use of the Dap- per annotation APIs. The Guice[13] open-source AOP framework was used to label important software compo- nents as “@Traced.” Traces were further annotated with information about the size of input and output to impor- tant subroutines, status messages, and other debugging information which would otherwise be sent to a log file.
There are ways in which Dapper falls short for the Ads Review team. For instance, they would like to search over all of their trace annotations in interactive time, but must instead run a custom MapReduce or inspect indi- vidual traces manually. Also, there are other systems at Google which collect and centralize information from general-purpose debug logs, and it is not trivial to inte- grate large volumes of data from these systems and the Dapper repositories.
In all, though, the Ads Review team estimates that their latency numbers have improved by two orders of magnitude using data gleaned from the Dapper tracing platform.
6.1.1 Integration with exception monitoring
Google maintains a service which continually collects and centralizes exception reports from running pro-cesses. If these
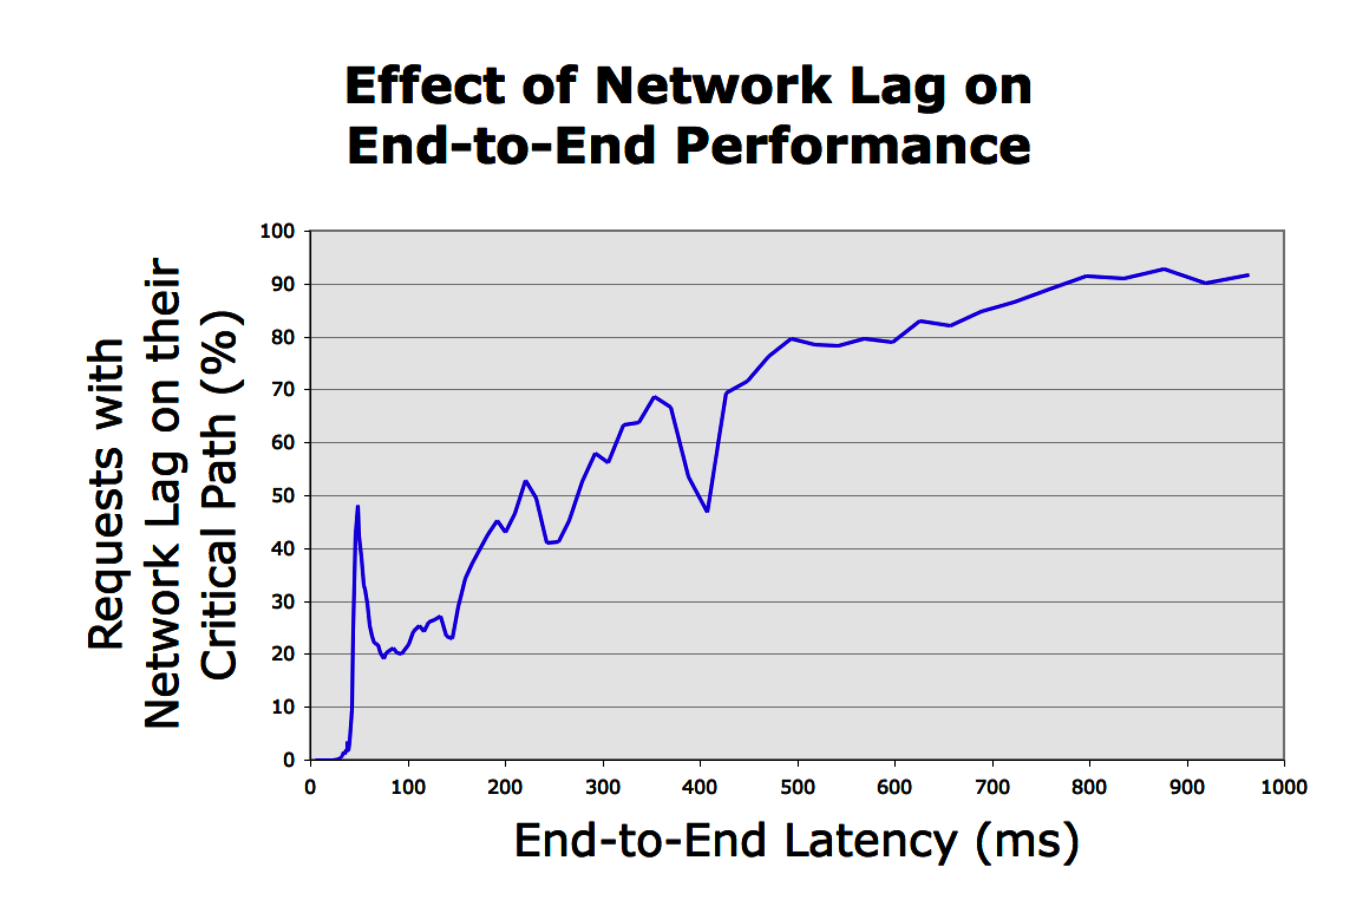
Figure 7: The fraction of universal search traces which encountered unusually high network lag some- where along their critical path, shown as a function of end-to-end request latency.
exceptions occurred in the context of a sampled Dapper trace, the appropriate trace and span ids are included as metadata in the exception report. The frontend to the exception monitoring service then pro- vides links from specific exception reports to their re- spective distributed traces. The Ads Review team used this feature to understand the larger forensic context of bugs identified by the exception monitoring service. By exporting interfaces built around simple unique ids, the Dapper platform is integrated into other event monitoring systems with relative ease.
6.2 Addressing long tail latency
Due to the number of moving parts and the size and scope of the codebase and deployment, debugging services like universal search (described earlier in Section 1) is very challenging. Here we describe efforts made to attenuate the long tail of the universal search latency distribution. Dapper was able to validate hypotheses about end-to-end latency and, more specifically, the critical path for uni- versal search requests. When systems involve not just dozens of subsystems but dozens of engineering teams, even our best and most experienced engineers routinely guess wrong about the root cause of poor end-to-end per- formance. In such situations, Dapper can furnish much- needed facts and is able to answer many important per- formance questions conclusively.
An engineer working on long tail latency debugging built a small library which infers hierarchical critical paths from DAPI Trace objects. These critical path structures were then used to diagnose problems and pri- oritize prospective performance improvements for uni- versal search. This work with Dapper led to the follow- ing discoveries:
- Momentary degradation in network performance along the critical path does not affect system throughput, but it can have a profound effect on out- lier latency. As seen in Figure 7, most of the slow Universal Search traces experienced network degra- dation along their critical path.
- There were many problematic and expensive query patterns which resulted from unintended interac- tions between services. Once identified they were often corrected for easily, but identification itself was difficult before Dapper.
- Common queries were harvested from a secure logs repository outside of Dapper, and, using Dapper’s unique trace ids, joined with the Dapper reposito- ries. This mapping was then used to build lists of example queries which were slow for each individ- ual sub-system within universal search.
6.3 Inferring service dependencies
At any given time, a typical computing cluster at Google is host to thousands of logical “jobs”; sets of processes performing a common function. Google maintains many such clusters, of course, and indeed we find that the jobs in one computing cluster often depend on jobs in other clusters. Because dependencies between jobs change dynamically, it is not possible to infer all inter-service dependencies through configuration information alone. Still, various processes within the company require accu- rate service dependency information in order to identify bottlenecks and plan service moves among other things. Google’s appropriately-named “Service Dependencies” project has made use of trace annotations and the DAPI MapReduce interface in an effort to automate service de- pendency determination.
Using Dapper’s core instrumentation along with Dap- per trace annotations, the service dependencies project is able to infer dependencies between individual jobs, as well as dependencies on shared software infrastructure used by those jobs. For instance, all Bigtable operations are tagged with the name of the affected table. Using the Dapper platform, the service dependencies team is thus able to automatically infer dependencies on named resources at various service granularities.
6.4 Network usage of different services
Google devotes substantial human and material re- sources to its networking fabric. Not surprisingly, net- work operators have long had access to monitoring infor- mation from individual pieces of hardware, and custom tools and dashboards were built to give a birds-eye view of global network utilization. Network operators had rea- sonable visibility into the overall health of our wide-area network, but, when there were problems, they had few tools which could properly attribute network load to an application-level culprit.
Though Dapper was not designed for link-level moni- toring, we have found that it is well-suited to the task of application-level analysis of inter-cluster network activ- ity. Google was able to leverage the Dapper platform to build a continuously-updating console showing the most active application-level endpoints for inter-cluster net- work traffic. Furthermore, using Dapper we are able to point to the causal trace root for these expensive network requests rather than restricting ourselves to the two peer machines in isolation. The dashboard was built on top of the Dapper APIs in less than 2 weeks.
6.5 Layered and Shared Storage Systems
Many storage systems at Google are composed of mul- tiple independently complex layers of distributed infras- tructure. For instance, the Google App Engine[5] is built on top of a scalable entity storage system. This entity storage system exposes certain RDBMS functionality on top of an underlying BigTable. Bigtable in turn uses both Chubby[7] (a distributed lock system) and GFS. More- over, systems like BigTable are managed as a shared ser- vice in order to simplify deployment and better utilize computing resources.
In such layered systems it is not always easy to deter- mine end-user resource consumption patterns. For exam- ple, a high degree of GFS traffic from a given BigTable cell could be originating from one user mostly or several users, while at the GFS level the difference between these two distinct usage patterns is obscured. Moreover, con- tention for such shared services can be similarly difficult to debug in the absence of tools like Dapper.
The Dapper user interface shown in Section 5.2 can group and aggregate trace performance information across the various clients of any shared service. This makes it easy for the owners of shared services to rank their users in terms of various metrics (e.g., inbound net- work load, outbound network load, or total time spent servicing requests).
6.6 Firefighting with Dapper
Dapper is useful for some but not all firefighting tasks. “Firefighting” here refers to activities performed on be- half of a distributed system in peril. Typically, Dapper users who are firefighting need access to fresh data and do not have time to write new DAPI code or wait for pe- riodic reports to run.
For services which are experiencing high latencies or, worse still, timing out given a normal workload, the Dap- per user interface can often isolate the location of the la- tency bottleneck. By communicating directly with the Dapper daemons, fresh data about specific high-latency traces can be gathered without difficulty. During catas- trophic failures, it is usually not necessary to look at ag- gregate statistics to determine root causes and example traces are sufficient.
However, shared storage services like those described in Section 6.5 require aggregated information as soon as possible during a sudden spike in user activity. For event post-mortems, shared services can still make use of the aggregated Dapper data, but until bulk analysis of col- lected Dapper data can complete within 10 minutes of an event onset, Dapper will not be as useful as it could be for firefighting problems with shared storage services.
7 Other Lessons Learned
Although our experience with Dapper thus far has gen- erally met our expectations, there were some positive as- pects that we did not fully anticipate. We were particu- larly pleased with the number of unintended use cases. In addition to several of the experiences described in Sec- tion 6, these also include resource accounting systems, tools that check that sensitive services conform to spec- ified communication patterns, and an analysis of RPC compression strategies, among others. We attribute these unintended uses in part to the decision to open our trace datastores to developers through a simple programming interface, as this allowed us to harness the creativity of a much larger community. The addition of Dapper sup- port to legacy workloads was also simpler than expected, requiring only a re-compile with new versions of exist- ing libraries for programs that were using the common supported threading, control flow, and RPC frameworks.
Dapper’s broad usage within Google has also provided us with valuable feedback on some of its limitations. Be- low we describe some of the most important ones we have identified to date.
Coalescing effects: Our model implicitly assumes that various subsystems will perform work for one traced re- quest at a time. In some cases it is more efficient to buffer a few requests before performing an operation on a group of requests at once (coalescing of disk writes is one such example). In such instances, a traced request can be blamed for a deceptively large unit of work. Moreover, if multiple traced requests are batched together, only one of them will appear responsible for the span due to our reliance on a single unique trace id for each trace. We are considering solutions that could identify these cases and log the minimum amount of information required to disambiguate them.
Tracing batch workloads: Dapper’s design was tar- geted at on-line serving systems, and the original objec- tive was to understand system behavior resulting from a user request to Google. However, off-line data inten- sive workloads, such as those that fit the MapReduce [10] model, can also benefit from better performance insight. In such cases, we need to associate a trace id with some other meaningful unit of work, such as a key (or range of keys) in the input data, or a MapReduce shard.
Finding a root cause: Dapper is effective in determin- ing which part of a system is experiencing slowdowns, but is not always sufficient for finding the root causes. For example, a request may be slow not because of its own behavior, but because other requests were queued ahead of it. Programs can make use of application-level annotations to relay queue sizes or overload situations to the tracing system. Also, if such effects are common, the paired sampling technique proposed in ProfileMe [11] could prove useful. It consists of sampling two time- overlapping requests, and observing their relative laten- cies throughout the system.
Logging kernel-level information: Detailed informa- tion about kernel-visible events would sometimes be use- ful in root cause determination. We have a number of tools capable of tracing or otherwise profiling kernel ex- ecution, but tying that information to a trace context that resides at user level is difficult to accomplish in a general and unobtrusive manner. We are investigating a possible compromise solution, in which we take snapshots of a few kernel-level activity parameters from user level and associate them with an active span.
8 Related Work
There is a healthy body of work in the area of distributed systems tracing, with some systems primarily focusing on pinpointing faults while others aim at performance optimization. Dapper has been used for fault discovery, but it has generally been more useful in uncovering per- formance issues and improving the general understand- ing of the behavior of large complex workloads.
Dapper is related to black-box monitoring systems, such as Project5 [1], WAP5 [15] and the Sherlock system [2], which arguably can achieve an even higher degree of application-level transparency by not relying in run-time library instrumentation. The disadvantage of black-box schemes are some amount of imprecision and possibly larger overheads involved in the statistical inference of causal paths.
Explicit annotation-based instrumentation of middle- ware or applications themselves is perhaps a more pop- ular approach to distributed systems monitoring. Pip[14] and Webmon[16] are examples of systems that rely more heavily on application level annotations, while X- Trace[12], Pinpoint [9] and Magpie [3] mostly focus on library and middleware modifications. Dapper is most closely related to this latter group. Like Pinpoint, X- Trace, and the early version of Magpie, Dapper uses a global identifier to tie together related events from vari- ous parts of a distributed system. Also like these systems, Dapper attempts to obviate the need to annotate applica- tions by hiding instrumentation within common software modules. Magpie abandoned the use of global IDs, and the challenges of correctly propagating them, by adopt- ing an event schema that is written for each application and describes explicitly the relationships between events. It is unclear to us how effective schemas are in achiev- ing transparency in practice. X-Trace’s core annotation requirements are somewhat more ambitious than Dap- per’s, in that traces are collected not only at node bound- aries but also whenever control is passed between dif- ferent software layers within a node. Our strict require- ments for low-overhead instrumentation steered us away from such a model, and towards creating the minimum set of mechanisms that enable all work done on behalf of a given original request to be tied together. Dapper traces can still be enriched by optional application annotations.
9 Conclusions
In this paper we have introduced Dapper, Google’s pro- duction distributed systems tracing platform, and re- ported on our experience developing and using it. Dap- per is deployed across virtually all of Google’s systems, and has allowed the vast majority of our largest work- loads to be traced without need for any application-level modifications, and with no noticeable performance im- pact. Dapper’s utility to developers and operations teams is evidenced by the popularity of the main tracing user interface and illustrated here through examples of use cases, even some which were not anticipated by its de- signers.
To our knowledge, this is the first article to report on a large, production distributed systems tracing framework. In fact our main contributions derive from the fact that we report retrospectively on a system that has been op- erational for over two years. We have found, for exam- ple, that the decision to combine a minimal application- transparent tracing functionality with a simple API for programmers to enhance traces has been worthwhile.
We believe that Dapper achieves a higher degree of application-level transparency than previous annotation- based distributed tracing systems, as demonstrated by the small number of workloads that required manual inter- vention. While this has been facilitated by the somewhat unusual homogeneity of our computing deployment, it was still a significant challenge. Most importantly, our design suggests some sufficient conditions for realizing application-level transparency which we hope might help others develop solutions for more heterogeneous envi- ronments.
Finally, by opening Dapper’s trace repositories to in- ternal developers we have enabled the creation of many more analysis tools than the Dapper team alone could have been able to produce in isolation, greatly leverag- ing the design and implementation effort.
Acknowledgments
We thank Mahesh Palekar, Cliff Biffle, Thomas Kotz- mann, Kevin Gibbs, Yonatan Zunger, Michael Kleber, and Toby Smith for their experimental data and feedback about Dapper experiences. We also thank Silvius Rus for his assistance with load testing. Most importantly, though, we thank the outstanding team of engineers who have continued to develop and improve Dapper over the years; in order of appearance, Sharon Perl, Dick Sites, Rob von Behren, Tony DeWitt, Don Pazel, Ofer Zajicek, Anthony Zana, Hyang-Ah Kim, Joshua MacDonald, Dan Sturman, Glenn Willen, Alex Kehlenbeck, Brian McBar- ron, Michael Kleber, Chris Povirk, Bradley White, Toby Smith, Todd Derr, Michael De Rosa, and Athicha Muthi- tacharoen. They have all done a tremendous amount of work to make Dapper a day-to-day reality at Google.
References
[1] M. K. Aguilera, J. C. Mogul, J. L. Wiener, P. Reynolds, and A. Muthitacharoen. Performance Debugging for Dis- tributed Systems of Black Boxes. In Proceedings of the 19th ACM Symposium on Operating Systems Principles, December 2003.
[2] P. Bahl, R. Chandra, A. Greenberg, S. Kandula, D. A. Maltz, and M. Zhang. Towards Highly Reliable Enter- prise Network Services Via Inference of Multi-level De- pendencies. In Proceedings of SIGCOMM, 2007.
[3] P.Barham,R.Isaacs,R.Mortier,andD.Narayanan.Mag- pie: online modelling and performance-aware systems. In Proceedings of USENIX HotOS IX, 2003.
[4] L. A. Barroso, J. Dean, and U. Ho ̈lzle. Web Search for a Planet: The Google Cluster Architecture. IEEE Micro, 23(2):22–28, March/April 2003.
[5] T. O. G. Blog. Developers, start your engines. http://googleblog.blogspot.com/2008/04/developers- start-your-engines.html, 2007.
[6] T. O. G. Blog. Universal search: The best answer is still the best answer. http://googleblog.blogspot.com/2007/05/universal- search-best-answer-is-still.html, 2007.
[7] M. Burrows. The Chubby lock service for loosely- coupled distributed systems. In Proceedings of the 7th USENIX Symposium on Operating Systems Design and Implementation, pages 335 – 350, 2006.
[8] F. Chang, J. Dean, S. Ghemawat, W. C. Hsieh, D. A. Wal- lach, M. Burrows, T. Chandra, A. Fikes, and R. E. Gru- ber. Bigtable: A Distributed Storage System for Struc- tured Data. In Proceedings of the 7th USENIX Sympo- sium on Operating Systems Design and Implementation (OSDI’06), November 2006.
[9] M. Y. Chen, E. Kiciman, E. Fratkin, A. fox, and E. Brewer. Pinpoint: Problem Determination in Large, Dynamic Internet Services. In Proceedings of ACM In- ternational Conference on Dependable Systems and Net- works, 2002.
[10] J. Dean and S. Ghemawat. MapReduce: Simplified Data Processing on Large Clusters. In Proceedings of the 6th USENIX Symposium on Operating Systems Design and Implementation (OSDI’04), pages 137 – 150, December 2004.
[11] J. Dean, J. E. Hicks, C. A. Waldspurger, W. E. Weihl, and G. Chrysos. ProfileMe: Hardware Support for Instruction-Level Profiling on Out-of-Order Processors. In Proceedings of the IEEE/ACM International Sympo- sium on Microarchitecture, 1997.
[12] R. Fonseca, G. Porter, R. H. Katz, S. Shenker, and I. Sto- ica. X-Trace: A Pervasive Network Tracing Framework. In Proceedings of USENIX NSDI, 2007.
[13] B. Lee and K. Bourrillion. The Guice Project Home Page. http://code.google.com/p/google-guice/, 2007.
[14] P. Reynolds, C. Killian, J. L. Wiener, J. C. Mogul, M. A. Shah, and A. Vahdat. Pip: Detecting the Unexpected in Distributed Systems. In Proceedings of USENIX NSDI, 2006.
[15] P. Reynolds, J. L. Wiener, J. C. Mogul, M. K. Aguilera, and A. Vahdat. WAP5: Black Box Performance Debug- ging for Wide-Area Systems. In Proceedings of the 15th International World Wide Web Conference, 2006.
[16] P. K. G. T. Gschwind, K. Eshghi and K. Wurster. Web- Mon: A Performance Profiler for Web Transactions. In E-Commerce Workshop, 2002.
tags: